Did you know New Westminster is a Sanctuary City?
This means that everyone—regardless of immigration status—is welcome to access City facilities, programs, and services without being asked about their status. It’s part of New Westminster’s commitment to inclusion, dignity, and equity for all residents and visitors. Click here for more information.
NEW WESTMINSTER AT GLANCE [1]
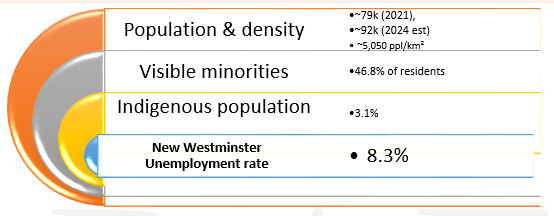
- New Westminster is one of the fastest growing and most diverse cities in British Columbia. With a 2021 population of 78,916 and an estimated 85,000+ residents by 2025, the city continues to attract newcomers from around the world. Immigration is a key driver of this growth, shaping the city’s social, cultural, and economic life.
Next major update will come with the 2026 Census (scheduled for May 2026) and subsequent refined estimates from StatsCan.
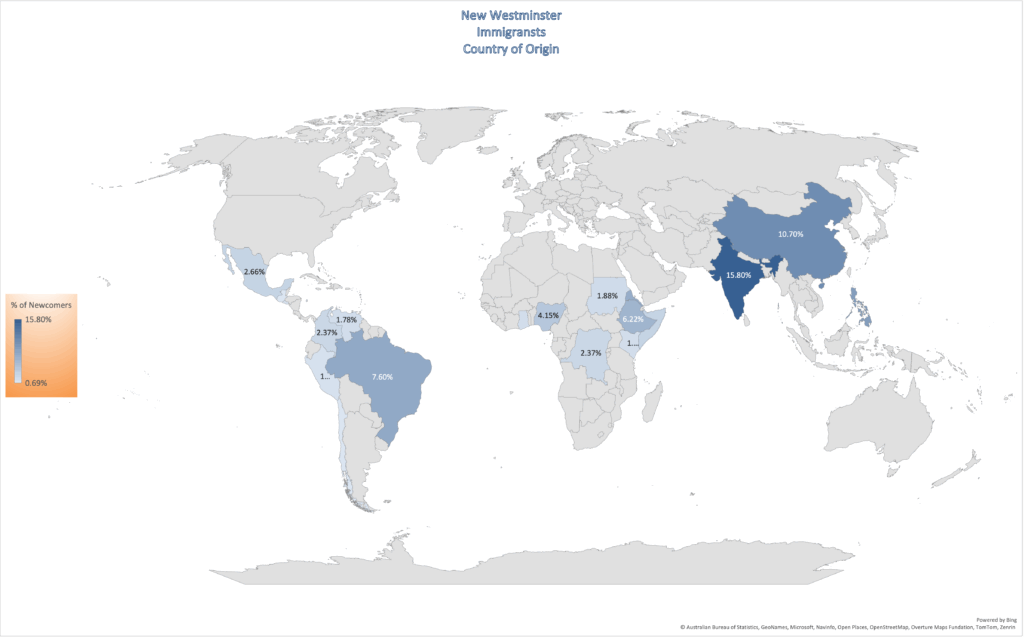
Top Countries of Birth (Recent Immigrants)
New to BC 2023
| Country | % of Newcomers |
|---|---|
| India | 15.80% |
| China | 10.70% |
| Philippines | 8.80% |
| Brazil | 7.60% |
| Eritrea | 7.01% |
| Ethiopia | 6.22% |
| Nigeria | 4.15% |
| Somalia | 3.16% |
| Mexico | 2.66% |
| Colombia | 2.37% |
| Democratic Republic of the Congo | 2.37% |
| Sudan | 1.88% |
| Venezuela | 1.78% |
| Kenya | 1.58% |
| Ghana | 1.48% |
| Peru | 1.28% |
| El Salvador | 1.09% |
| Chile | 0.79% |
| Guatemala | 0.69% |
Diversity in New Westminster
46.8% of the population identifies as a visible minority, reflecting the growing diversity of the city.
Indigenous Peoples make up 3.1% of the total population (~2,445 people), reminding us of the importance of centering reconciliation alongside welcoming newcomers.
Recent data presented at the WINS LIP table (March 2026) shows that refugee and protected persons arrivals in New Westminster have more than double over the past five years.
- This is slightly higher than the Metro Vancouver average, suggesting that New Westminster plays a key role in providing safe place for people fleeing conflict, persecution, or crisis.
- Refugees often need additional social, and settlement supports, indicating a responsibility for the community and service providers.
Immigration Trends (2015–2023)
According to the information given, is clear that New Westminster has seen a big increase in newcomers over the past decade:
Permanent residents grew steadily, especially after 2018. In 2023, 1,260 people became permanent residents.
Temporary residents under the International Mobility Program rose from 95 in 2015 to 670 in 2023 — that’s a 606% increase.
International students also increased, from 1,730 in 2015 to 4,140 in 2022.
This shows that New Westminster is becoming a more popular place for people to live, work, and study.
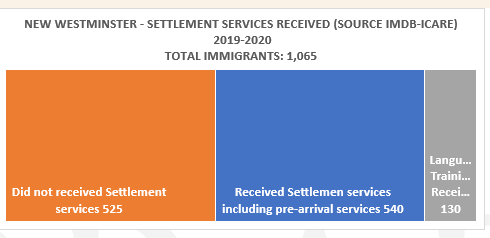
Settlement Services and Language Training
In 2019–2020, just over half of the immigrants in New Westminster received settlement services, including pre-arrival support. However, according to these numbers, a significant portion—nearly 50%—did not access any services, and smaller percentage received language training. This might have highlight both the reach and the gaps in local newcomer support.
New Westminster Immigrants Gender Breakdown (2021)
Among immigrants: 285 were male, and 305 were female — a fairly even split.
Settlement Patterns & Housing 🏠
Housing remains a challenge in Metro Vancouver.
New Westminster is a densely populated urban center (~5,050 people/km²).
Most newcomers settle in apartments or condos, reflecting the city’s housing stock:
- 69.5% apartments
- 13.8% single-family homes
- Row houses and duplexes make up the remainder.
Housing Conditions (2021)
In 2021 in New Westminster:
5,680 immigrants lived in overcrowded home.
7,505 immigrants spent more than they could afford on housing.
13,275 immigrants lived in housing that failed to meet at least one standard (repairs, space, or affordability).
| Housing Indicator | Immigrants (%) | |
| Living in Overcrowded Conditions | 38.8% | |
| Living in Unaffordable Housing | 51.2% | |
| Not Meeting One or More Housing Standards | 47% |
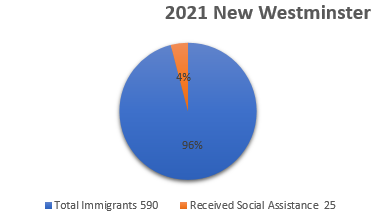
Newcomers and Social Assistance (2021)
Despite employment, affordability and housing challenges, most newcomers are not relying on social assistance, which may reflect strong community support or personal resilience.
None of the economic immigrants or family-sponsored immigrants received social assistance and only 4.2% of immigrants in New Westminster accessed social assistance in 2021. This is a relatively low rate, especially when compared to housing challenges, suggesting that while many face affordability issues, few are accessing income support.
Economic Participation & Income
- Newcomers still face barriers to employment, including recognition of foreign credentials and language access, though the city offers growing opportunities in healthcare, education, retail, and the tech sector.
- Unemployment rate (city-wide): ~8.3%, but newcomer-specific rates are often higher (no detailed local immigrant employment data, but national trends suggest ~10–12% for recent immigrants).
What the Data Tells Us: Key Community Realities
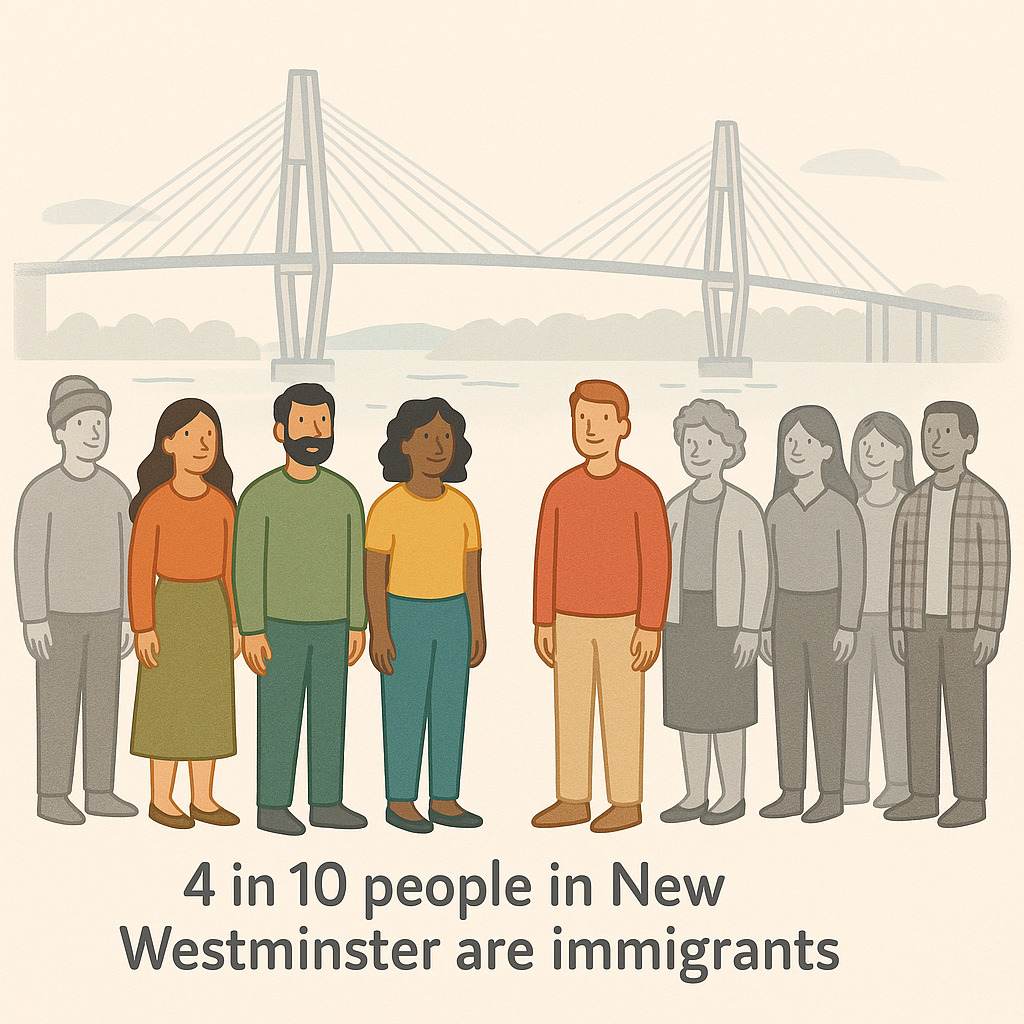
- 37.5% of New Westminster residents are immigrants—that’s nearly 4 in 10 people. 5,050 recent immigrants settled in New Westminster during the last census period. This proportion is higher than the national average (23.0% in Canada) and reflects the city’s long history as a gateway for newcomers.
- New Westminster is one of the most immigrant-dense small cities in BC.
- Immigration patterns are shifting. While countries like China, India, and the Philippines remain important sources of newcomers, there are growing numbers of immigrants from Africa and Latin America.[3]
- Community services, programs, and spaces must reflect the languages, cultures, and lived experiences of all residents to create a true sense of belonging.
- Economic and housing pressures continue to challenge immigrant well-being, creating barriers to long-term stability.
- While mental health supports have improved, food insecurity and housing affordability remain critical concerns for many.
- There are information gaps around international students and temporary residents, but we know New Westminster is home to students at Douglas College and other institutions, adding to the population of young people and temporary workers.
- The community will increasingly need culturally safe, trauma-informed services, digital literacy support, and employment pathways, especially for newcomers facing complex barriers.
[1] Sources:
NewToBC. (2023). Immigrant demographic profile: New Westminster. Libraries in the Settlement Sector. Retrieved from https://newtobc.ca/wp-content/uploads/2023/11/2023-NewToBC-New-Westminster-DemoProfile-WEB-Final-R.pdf
City of New Westminster. (2021). Census highlights. Retrieved from https://www.newwestcity.ca/statistics/sb_expander_articles/2761.php
Statistics Canada. (2022). Census profile, 2021 census of population: New Westminster, City [Census subdivision], British Columbia. Retrieved from https://www12.statcan.gc.ca/census-recensement/2021/dp-pd/prof/index.cfm?Lang=E
Immigration, Refugees and Citizenship Canada. (2022). 2021 Annual report to Parliament on immigration. Government of Canada. Retrieved from https://www.canada.ca/en/immigration-refugees-citizenship/corporate/publications-manuals/annual-report-parliament-immigration-2021.html
[2] LIPData.ca. https://lipdata.ca/. Accessed 1 Aug. 2025.
Fenn, S. (2022, November 4). Immigration drives population growth in New Westminster. New West Record. https://www.newwestrecord.ca/local-news/immigration-drives-population-growth-in-new-westminster-6052724